The number of tools that are made available to increase efficiency, productivity and facilitate routine in companies is increasing.
In today's article we will talk about the Gantt chart: what it is and what it is for. Follow:
What is the Gantt Chart?
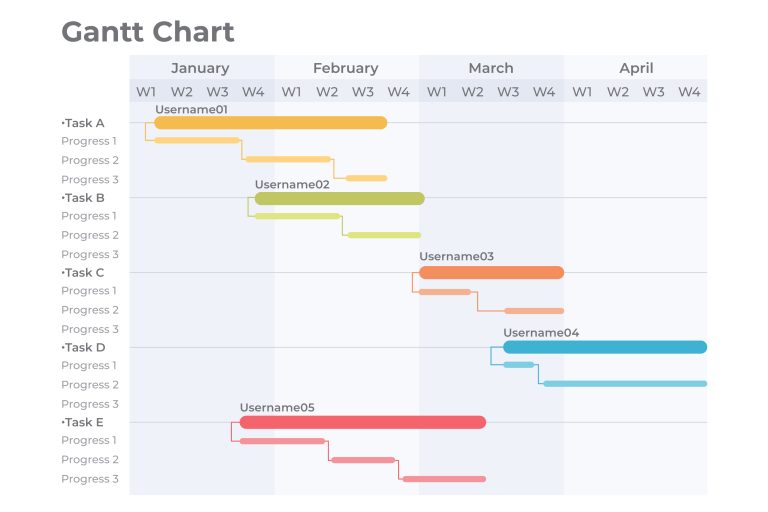
The Gantt Chart or Gantt Diagram is a visual tool used to control and manage a schedule of activities in a project, helping to assess delivery times and critical resources.
It has dates for carrying out and delivering tasks, as well as a list of materials.
The diagram's structure, similar to a timeline, presents an efficient organization for project planning. Divided into axes, the vertical axis highlights the tasks to be performed, while the horizontal axis indicates the start and end time of each activity. Combining these two axes offers a clear view of the project schedule and the priority of tasks.
In it, it is possible to list the areas present in the process and thus identify those responsible for each task.
>> Read also: Business transparency and its importanceThe

What is the Gantt Chart used for?
The chart serves to organize and track the progress of a project. It was also created to reduce delays in production. With the information about the project, the manager can monitor and check if the progress is as planned.
It also serves to divide tasks. Therefore, it is possible to take an activity and divide it into parts, putting what to do before starting it, how to prepare it and its steps.
Through the diagram it is possible to understand the relationship of the tasks, identify if a certain task depends on another, which one needs to finish for another to start, etc. Defining task dependencies is essential to meeting deadlines and ensuring project flow. Delaying or rushing a task can jeopardize the entire plan.
Defining deadlines is another use of the Gantt chart. By allocating all tasks knowing the priorities and identifying dependencies, it is possible to accurately define realistic deadlines, and even reduce them.
With activities, deadlines and priority defined, you can also assign people responsible, so when you need information, discover progress or align something, the manager knows exactly who he needs to talk to.
Error identification and workflow optimization
The diagram can be used to follow the process of production orders and scheduled operations on each machine in the factory, understanding bottlenecks and identifying machine idleness.
And as previously mentioned, providing project follow-up is one of the main functions of the diagram, not only for the manager, but for the team that will participate in the activities. This way, everyone can identify whether they are within the deadlines, whether they depend on another task and whether they need a strategy to reach the goal.
However, regarding project monitoring, it is important to remember that the diagram needs to be updated frequently, otherwise it is not possible to know which stage the project is at.
All these utilities come together to ensure visibility of the process, identifying possible errors and delays, so that inconsistencies and unforeseen events are reduced.

What are the benefits of the Gantt chart?
The main benefit of this chart is to achieve visibility of the processes, as this enables control and assertive decision-making.
Each of the functionalities of this chart are already benefits, but in addition to them we will see some others:
- Informing customers about actual deadlines, possible delays and project progress provides a transparent relationship;
- Optimize work;
- Centralize the team;
- Identify bottlenecks;
- Creation of planning;
- Increase productivity.

What is the structure of the Gantt Chart?
To assemble a Gantt chart correctly, you must first understand its structure, see:
Timeline bar chart
The timeline bar chart is key in a Gantt chart. It includes Gantt bars and other symbols that reference tasks, schedules, and relationships.
Gantt bar
A Gantt bar is the visual representation of a task. It shows the duration and type of a task. It can also show the percentage of completion of a task, floats and time, planned dates and actual dates.
task name
As the name implies, here is the explicit description of the tasks.
time scale
The timescale can represent days, hours, weeks, months, etc. It controls the time intervals displayed on the graph.
Frames
Milestones can be milestone dates or important checkpoints for a project, they are usually assigned to the completion of a project.
Dependencies
Dependencies are the relationship between one activity and another. They show when and if a task needs to finish for another to start.
Dates
Dates mark the start and end of individual activities and the project as a whole.
It is worth remembering that Gantt charts may present variations, however, this is the basic structure and information.

How to build a Gantt chart?
Making a Gantt chart is not that simple, however, if done correctly it can bring good results. Below, a list with the step by step to assemble your diagram:
1 – Identify the individual tasks
This step can be quite complicated and difficult, you need to identify the essential tasks and subtasks to complete your project.
2 – Determine the relationships between tasks
After finishing the list, you will need to align the relationships between tasks. Understanding which tasks depend on others, you can define the order and periods of start and completion.
3 – Create a timeline of activities
Be based on real deadlines. Consider the time required to create the individual tasks and possible delays before setting a deadline. Organize the tasks in order to notice the dependencies to obtain a strategic and effective action plan.
4 – Pass the information to the chart
Follow the structure of the Gantt chart and add all the collected information. Add the necessary symbols and if necessary a legend to identify them.
5 – Assign responsible
Link tasks to the individual or team, so everyone knows what role to play and the project flow remains orderly.
6 – Update the diagram as the project progresses
Remember to update the diagram, marking due dates, completed tasks, priorities and the like. This way, the entire team will be aware of the progress of the project.

Gantt Chart Differential
As we saw in the topic that explains what the Gantt chart is for, it is useful in an industrial environment, helping with production orders and scheduled machine operations, showing machine bottlenecks and idleness, in addition to bringing many other benefits.
And if having help in these areas is important to you, but you prefer not to do manual work, a system that provides these same functions in an automated way may be just what you need!
O Manufatura 360 is a system that delivers all these functions in a digital, automated and remote way! Know the reason and downtime of your machines, have connectivity between them and security alert, in addition to full traceability!
Do you want to know how else the Manufatura 360 can join the Gantt Chart and increase the efficiency of your industry? Visit our website and talk to one of our experts!
>>Read also: Six Sigma Methodology: Understand what it is and what it is for


